Regional
Atmospheric
Soaring
Prediction
BLIPMAP FORECASTS
Romania 2.2km


Regional
Atmospheric
Soaring
Prediction
BLIPMAP FORECASTS
Romania 2.2km
BLIPMAP stands for "Boundary Layer Information Prediction MAP" -- a model for soaring weather forecast. It has been developed by Dr. John W. (Jack) Glendening ("DrJack"), who is meteorologist and sailplane pilot himself. More information on the meteorological model can be found on DrJack's RASP website. There you also find a discussion forum for questions about the model or problems with the forecast.
Maps are generated every night between 00 and 11 EEST. Today's forecast uses observations from 18UTC yesterday. Tomorrow's forecast uses observations from 00UTC today. Please check the time imprinted on the maps.
Please note that all maps are experimental and the underlying model is under development. Personally I find the maps useful, but of course I assume no liability for anything and these maps cannot substitute for a real meteorological pre-flight preparation. The pilot is always responsible himself for everything he does.
A file for XCsoar is available for the current day. This file can be used to display within XCsoar the parameters marked with (*) bellow.
For de-briefing after your flight, yesterday's maps are here. Older files are kept in the archive.
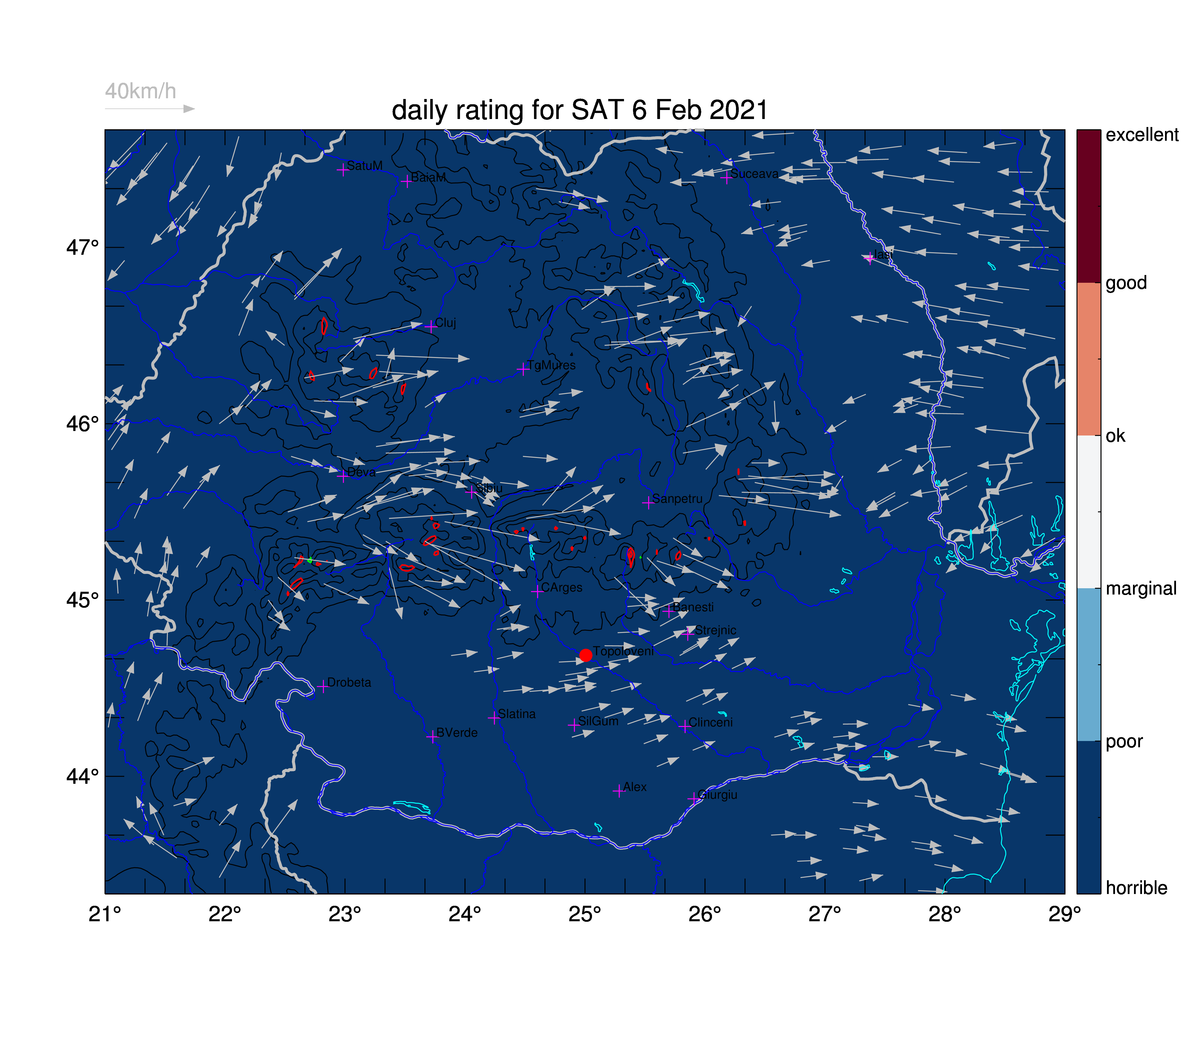
The Star Ratings measure qualitatively how good the soaring conditions are on a scale from 0 (horrible) to 5 (excellent) stars.
Regions above 5 are marked with a yellow contour.
The ratings are based on predictions of the weighted average Thermaling Height (AGL up to the cloud base, sink-rate of 1.15 m/s) between 10:00 to 18:00 LST (1 star /400m between 13 and 15 LST, less outside this interval).
Additional adjustments for Thermal Strength (-0.5, +1 star),
Cu Potential (+/-0.5 star),
Cloud streets potential (+0.25 star),
Wind speed (*[0,1]),
Buoyancy/Shear Ratio (*[0,1]),
and Overcast Development potential (-0.5 star) are applied.
The green contours show vertical upward motion of the air due to the wind (slope or convergence, not wave). The red contours show downward motion. Contours are spaced by 1m/s. If vertical motion contours are present, waves might be triggered if the temperature profile is favourable. Check the wave parameters plots below!.

|
|
| rating details | rating details |

|
|
|

|
|
|

|
| Reading weather charts |
Long term statistics of the thermal conditions can be viewed below
.
Multiannual
2019
2018
2017
2016
2015
 soaringspot
Bogdan Belu RASP GM
Bogdan Belu RASP DC
Top Meteo
XC Skyes
fcst24
XCmeteo
radar inmh
VentuSky
wunderground
weather charts
SkyVector
OpenAIP
OpenFlightMaps
AirTome -- Open source logbook
GpxSee
Thermal HotSpots
## AIS Romania ##
Waypoint files and Airspace can be found here. Of course I give no guaranties that the files are up to date or even correct. Before using, you should first check the corresponding kml file in GoogleEarth, or better, to check the information on ground. An overview of the Waypoints (WP_all) can be seen here:


